Let’s start from putting forward a disappointing thesis: when it comes to apartments (or any other residential real estate you are considering to acquire to live in at this point), unfortunately, the short answer to this question is that there really is no golden rule here (although you may find many that think otherwise) but to closely examine and analyse every particular case (or better yet, a few comparable cases), taking into account current and future (estimated) market conditions, as well as your own financial situation, investment objectives, risk appetite, and time horizon. The outcome will vary, based on the hard numbers and assumptions being used, and what looks good to one, may not to another.
Having said that, in this article we want to examine one particular case by analyzing two comparable apartments we have written about before – one available for rent, and the other listed for sale (currently with a contract signed). They are, respectively, apartments #201 and #401, located at 370 Central Park West in New York City. As you can see from the address, they are both located in the same building and even in the same line, where #401 is just two flights above #201. While they share the same footprint, their interior layout vary slightly. We are guessing that #201 represents the original layout of this line, and #401 had been modified. Still, they are close enough to call them apples-to-apples, at least for the purpose of this exercise.
To perform our analysis, we will be using two financial calculators, publicly available online at nytimes.com and realtor.com websites (disclosure: we have no affiliation with either whatsoever). So, let’s get to work!
APARTMENTS BEING COMPARED
370 Central Park West, New York, NY 10025, Apartment #201, offered for Rent at $9,500 per month. We have assumed 1 month security deposit (not actually stated in the listing description), no broker fee (if rented directly from the owner /management company), and $135 renter’s insurance premium (annually).
vs.
370 Central Park West, New York, NY 10025, Apartment #401, offered for Sale at $2,700,000. Monthly maintenance expense equals $2,659, of which 41% is tax deductible (since it is a cooperative, this portion translates to real estate taxes). There is also a monthly fuel charge of $113. This cooperative allows for 75% financing.
PLUGGING THE NUMBERS IN
Using: http://www.nytimes.com/interactive/business/buy-rent-calculator.html
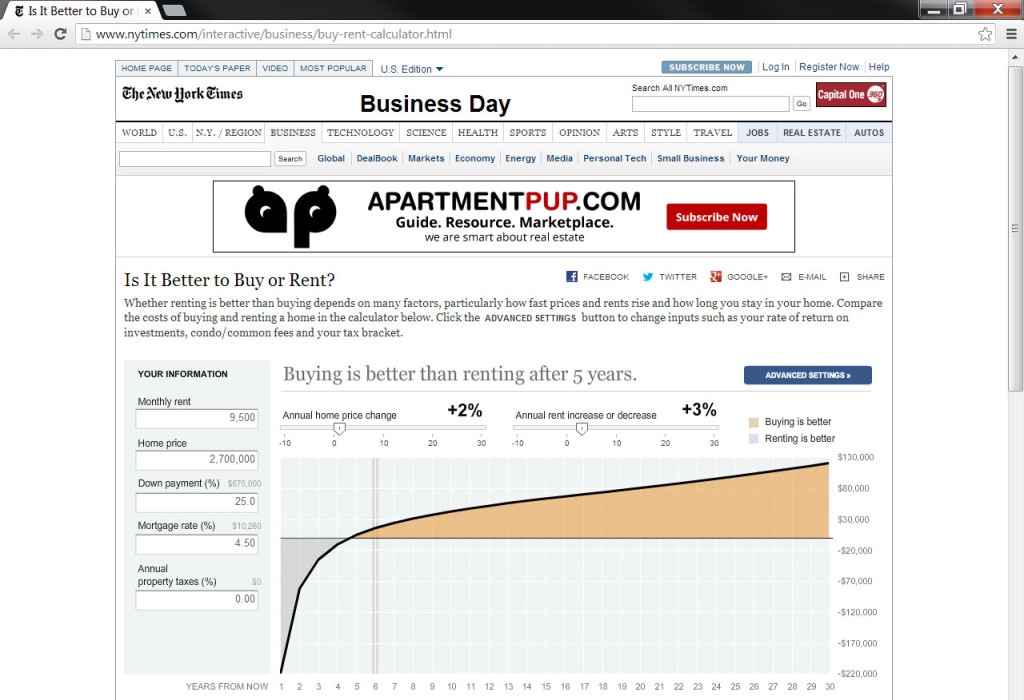
Main chart. You can see a break-even point somewhere in the second half of year five – or to round it up, let’s call it after year 5. What that means is that if you are about to stay in the apartment for less than 5 years, it is financially better for you to rent instead of buying. If longer, the opposite is true.
The numbers we have used here are: $9,500 for the monthly rent; $2,700,000 for the purchase price; 25% for the required down payment (this co-op only allows for up to 75% financing); 4.5% for the interest rate on a 30 years fixed-rate mortgage; and 0% for the annual property taxes (a little trick here: you will obviously pay taxes, but they are already included in your maintenance – see below).
Two assumptions here: annual home price change is set at 2%; and annual rent increase at 3%. Here is where we are guessing our best…
Let’s now take a look at some other numbers we have used and assumption we have made in this analysis (advanced settings tab):
We have inserted provided $2,659 for maintenance; 41% for tax deductibility (here are your property taxes); made an assumption of 4% for costs of purchasing your apartment (aka closing costs); agreed on industry standard 6% for costs of selling your apartment at the end of year six; and inserted 30 years for the length of the fixed-rate mortgage (to set a proper amortization).
Next we had to deal with annual renovation costs, annual maintenance costs, and homeowner’s insurance rate. The first are calculated by the system as a percentage of purchase price subsequently rising with inflation. Homeowner’s insurance rate represents percentage of the home’s value. By default, all three were set at 0.5%. We have chosen to lower those numbers down to 0.1% for each of the three (the lowest except for 0 this tabs could be set to), to receive a dollar value of approximately $3,000 for each per annum. You can obviously spend more than that, but if your are lucky, those numbers might sound about right as well.
Capital gains exclusion we left at $500,000, and for additional monthly utilities expense we inserted $113 (a price tag for the monthly fuel charge).
Next comes security deposit in a rental scenario; we left it at one month rent.
We left rental broker’s fee at 0 (percentage of annual rent), assuming one can find and use this complimentary listing information we provided, and rent directly from the owner /management company.
We inserted 0.12 for renter’s insurance rate (percentage of annual rent), to get as close as possible to $135 – a price we have verified with Geico (no affiliation).
In the last tab of the advanced settings called ‘other’, we had to deal with the rate of return on investments (described as annual rate of return on money that can be invested or saved). Think about your down payment, closing costs, and other fees when purchasing your apartment; selling commission when selling it few years down the line; or your rental deposit – money that you could save or use in a different manner if not getting into this particular type of transaction. It is your ultimate opportunity cost.
By default, it was – quite conservatively we think – set at 4%. We left it that way, but promised ourselves to come back here later and play with it a bit to show you how the whole picture is changing based on this one factor.
For the marginal tax rate (effective tax rate that includes your federal, state, and local taxes) we inserted 43.5%. To come up with this number, we have used 2012 tax tables for federal, state, and local income taxes, building our case on a married couple filing jointly, with a combined taxable income of $380,000. This scenario gives you 33% for federal, 6.85% for New York State, and 3.648% for New York City tax rates. By the way, $380,000 would also be, in most cases, a required income to qualify for the rent of $9,500 (according to a 40 x the monthly rent formula).
Last, but not least, we had to insert a number for the inflation rate (as an estimate of the future annual inflation rate). By default, it was set at 2%, and we left it like that. Would you agree?
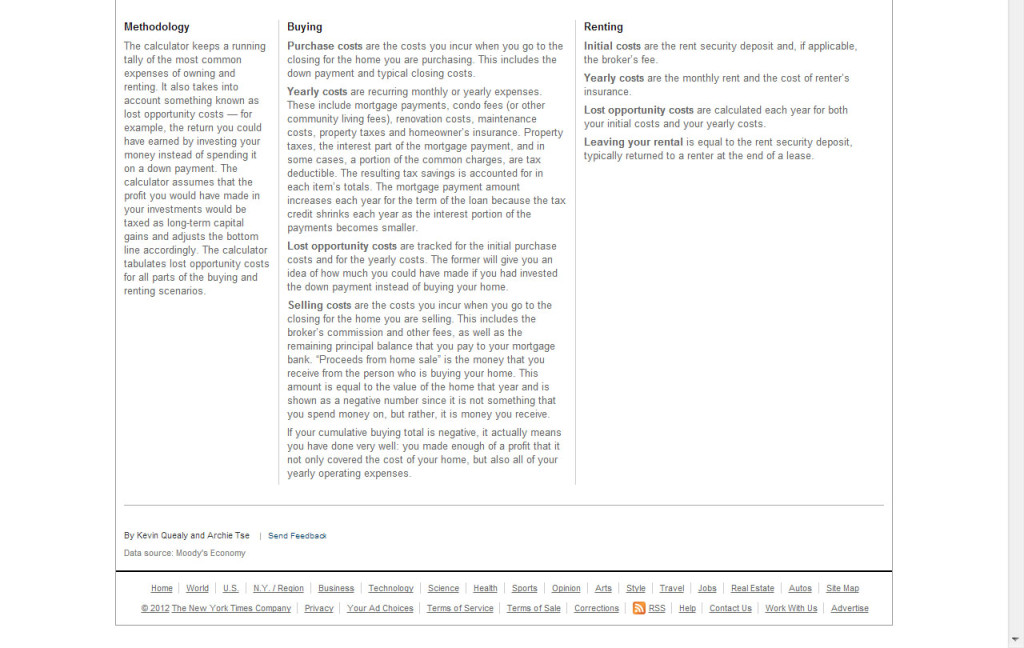
Below are the screen shots of year-by-year analysis and used methodology.
Calculator by Kevin Quealy and Archie Tse. Data source: Moody’s Economy (go there if you still question this 2% for the annual inflation…).
ALTERNATE APPROACH
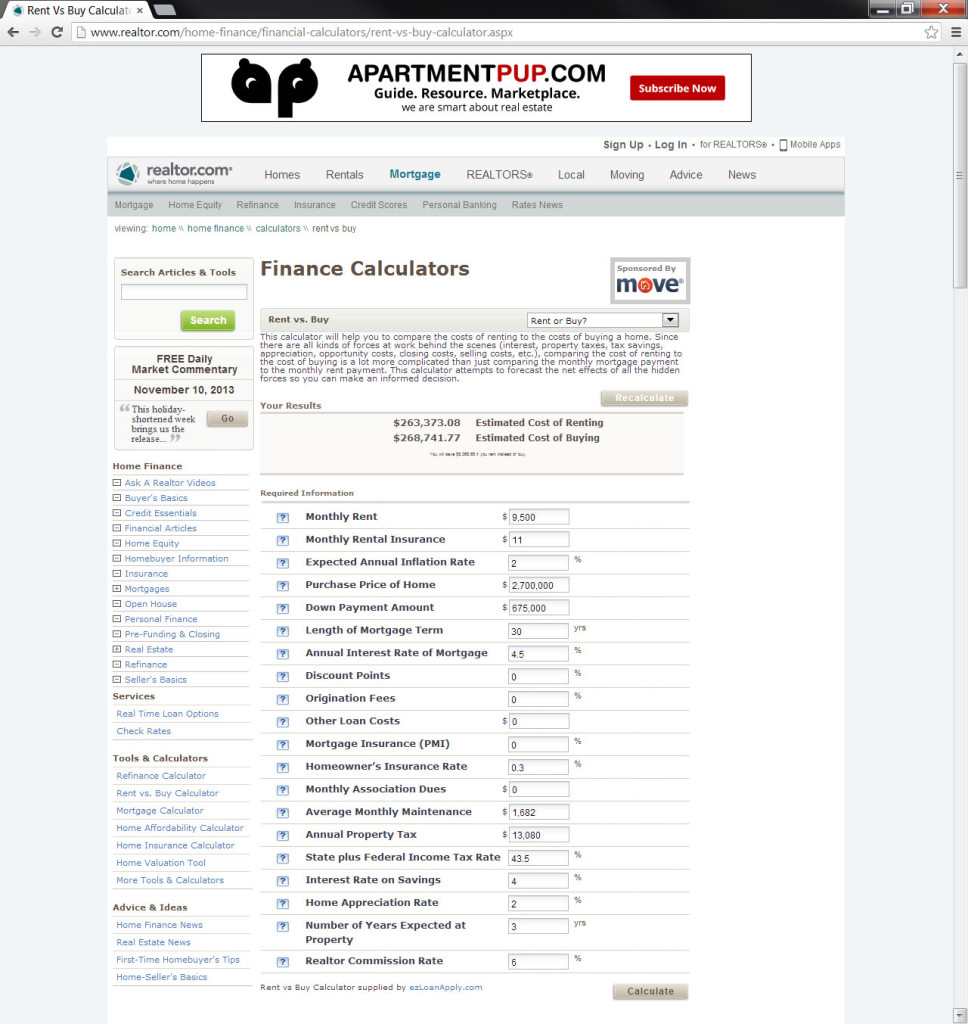
Using: http://www.realtor.com/home-finance/financial-calculators/rent-vs-buy-calculator.aspx
Less comprehensive, with fewer input options, hence taking off many important factors out of the equation. Inserting in the same numbers and making the same assumptions as we did when using the nytimes.com tool, the results we received were much more in favor of buying, with break-even point set at the end of year three. Perhaps the Realtors are more biased here, or the tool just isn’t good enough. Supplied by ezLoanApply.com which seems to be a domain name for sale. You be the judge.
More on the topic, including analyzing different scenarios, coming soon!

